|
- It draws a diagrams from your txt-data files.
- It scales your diagrams automatically or manually.
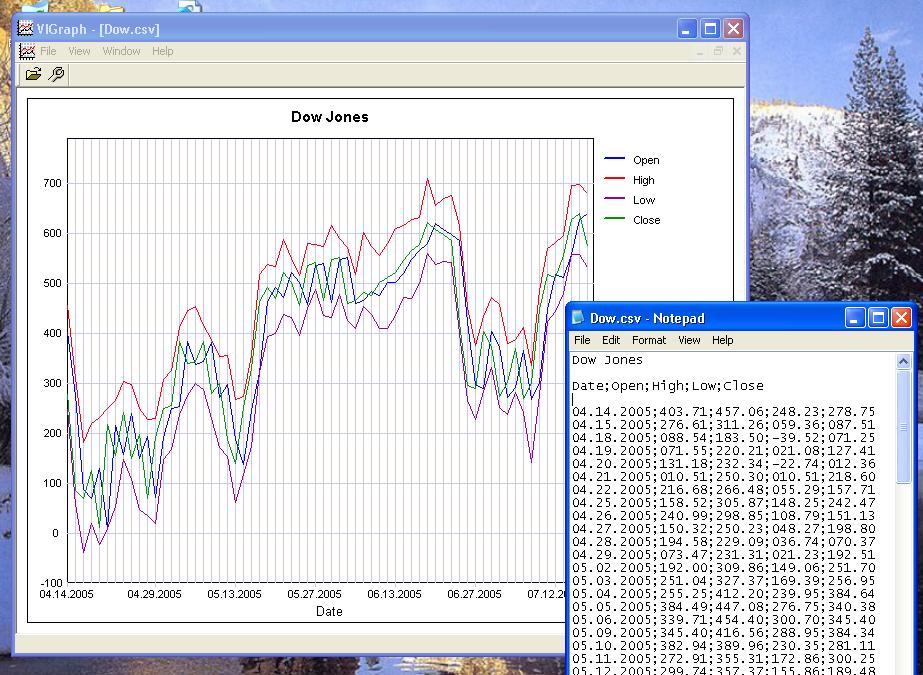
- Simply make a txt or csv (ASCII) file like that:
Dow Jones
Date; Open; High; Low; Close
4/14/2005; 10403.71; 10457.06; 10248.23; 10278.75
4/15/2005; 10276.61; 10311.26; 10059.36; 10087.51
4/18/2005; 10088.54; 10183.50; 9961.52; 10071.25
4/19/2005; 10071.55; 10220.21; 10021.08; 10127.41
4/20/2005; 10131.18; 10232.34; 9978.74; 10012.36
Run VIGraph and open that file. You will get a diagram with 4 colored lines (for Open; High; Low; Close). The header of diagramm will be "Dow Jones" and the horizontal axe below will be "Date".
- You can open as much txt-files as you need simultaneously.
- Columns in the txt-files can be divided by commas, tabulators or semicolons.
- Call a parameters dialog and define what to show in diagram..

Keywords: Graph, Diagram, txt, csv, Graphics, real time, FTT, Fast Fourier Transform, Interpolation, Spline
|

Click to enlarge
|
Related programs in Business - Math & Scientific Tools |
|
Text2Html
Text2Html is a freeware plain text to HTML converter
|
|
Cresotech PhotoPoint
Multimedia tool to create a photo presentation just in seconds.
|
|
Mihov Gallery Creator
Create and upload image galleries with thumbnails!
|
|
Xara Webstyle
A quick and easy way to produce quality web graphics - no skill required.
|
|
WPF Diagrams
Build interactive diagrams and model surfaces in WPF applications
|
|
odbc2csv
odbc2csv ODBC DSN information from the command line to csv
|
|
tables2csv
tables2csv ODBC table information from the command line to csv
|
|
dsn2csv
dsn2csv allows command line access to the local host ODBC table information
|
|
Hotspot Builder
Create hotspots and graphic elements for WinHelp and HTML Help files.
|
|
Visual Open DB
Generic data analysing application that allows you to query any data source.
|
|