|
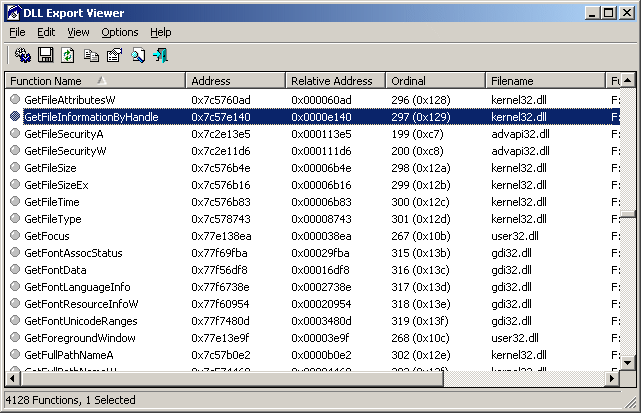
This utility displays the list of all exported functions and their virtual memory addresses for the specified DLL files. You can easily copy the memory address of the desired function, paste it into your debugger, and set a breakpoint for this memory address. When this function is called, the debugger will stop in the beginning of this function.
For example: If you want to break each time that a message box is going to be displayed, simply put breakpoints on the memory addresses of message-box functions: MessageBoxA, MessageBoxExA, and MessageBoxIndirectA (or MessageBoxW, MessageBoxExW, and MessageBoxIndirectW in unicode based applications) When one of the message-box functions is called, your debugger should break in the entry point of that function, and then you can look at call stack and go backward into the code that initiated this API call.

Keywords: dll, export, exports, functions, addresses, debug
|

Click to enlarge
|
Related programs in Development - Debugging |
|
Easydump for Oracle
EasyDump for Oracle is a GUI interface tool used to Export/Import data objects
|
|
AddrView
Extract URL addresses from HTML pages.
|
|
ParseRat File Parser Converter Restructurer
NEVER AGAIN RE-KEY LEGACY DATA: Extract usable data from just about anything.
|
|
odbc2csv
odbc2csv ODBC DSN information from the command line to csv
|
|
tables2csv
tables2csv ODBC table information from the command line to csv
|
|
dsn2csv
dsn2csv allows command line access to the local host ODBC table information
|
|
Scientific Calculator Precision 90
Scientific calculator for scientists, engineers, teachers, and students.
|
|
ResumePipe
Convert emailed resumes and attachments to text files for importing
|
|
Export Notes to Outlook
Export Notes to Outlook with prudent Lotus Notes to Outlook tool
|
|
A7Soft xml2csv
A7Soft xml2csv is a powerful command line tool for converting XML to CSV
|