|
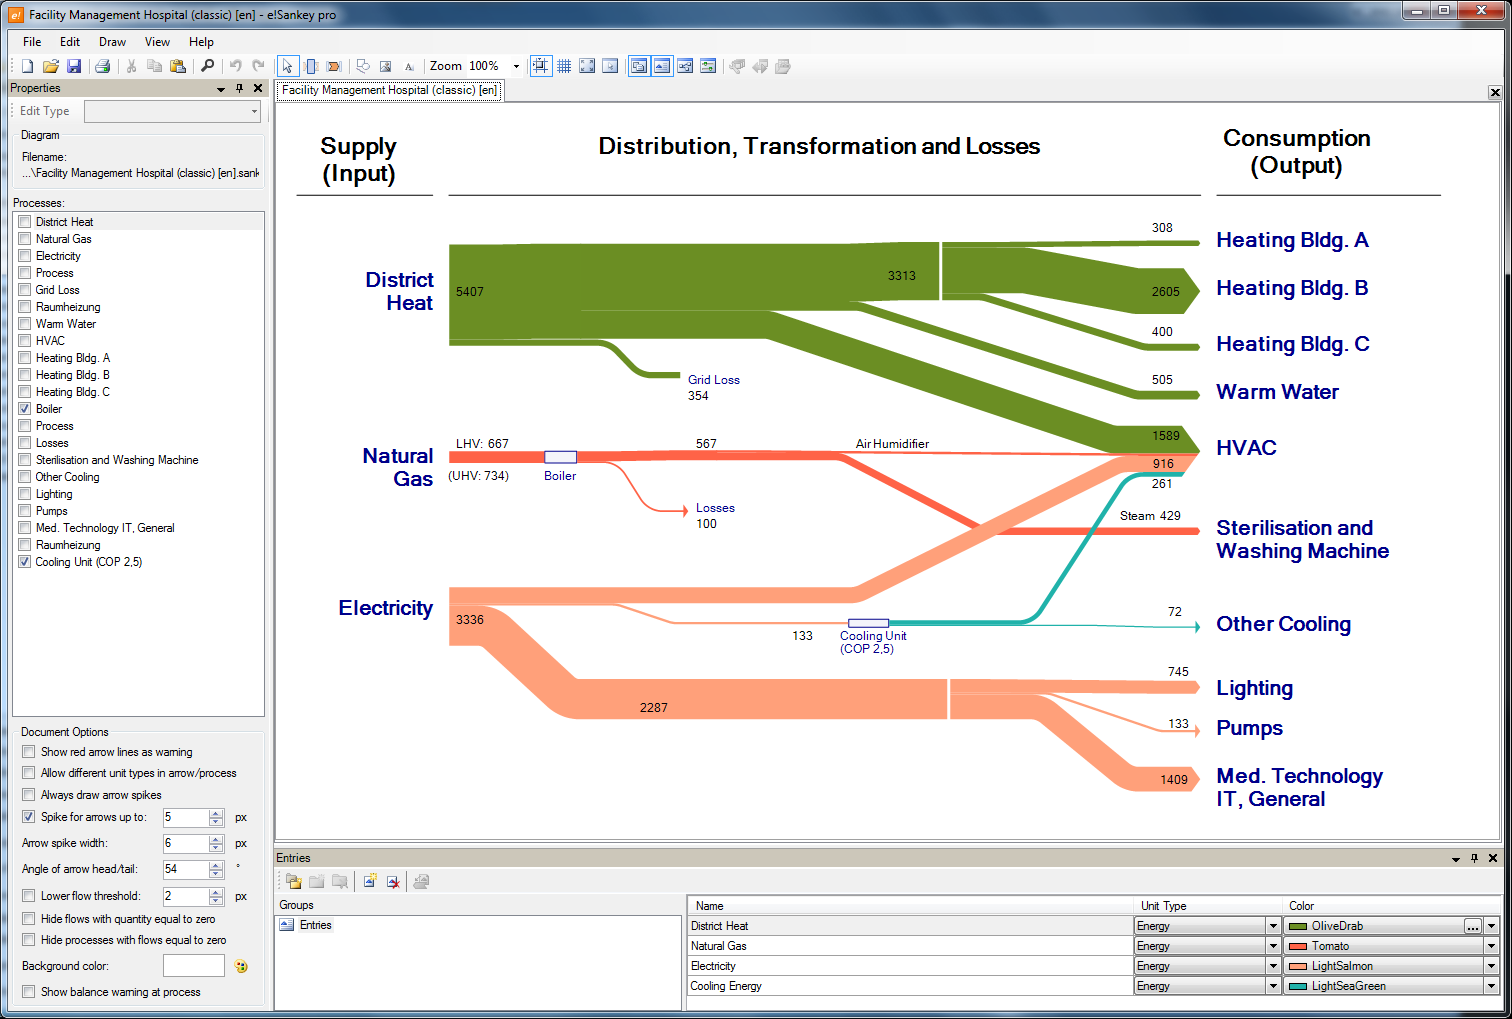
e!Sankey - a software tool to easily create Sankey diagrams. A Sankey diagram is a directional flow chart where the magnitude of the arrows is proportional to the quantity of flow. Sankey diagrams are a useful way of visualizing material flows, energy efficiency or costs.
If you are a chemical engineer, an environmental engineer or process engineer, a professional in quality management, logistics or finance, you can use e!Sankey diagrams to display flow quantities in a production system. Numerous display and scaling options help you get the best Sankey diagrams for your presentation.
e!Sankey makes drawing Sankey flow diagrams really easy.
Here are the main features of this software:
- graphical editor with process (node), arrows, labels, other graphical elements (e.g. rectangle, rounded rectangle, ellipse), lines, legend, text, image, numerous editor options (e.g. grid, snap to grid), legend, scale
- diagram: copy&paste, zooming, overview window
- use predefined template files
- Excel import withdynamic 'Live Link'
- multi element edit
- processes/nodes: drag and resize, use image, clipart gallery, edit/hide process label, hide nodes
- arrows: draw arrow connecting processes, reconnect, add flows to arrow, enter quantity, choose color, editable arrow label with flow name and quantity, add arrow bending points, stacked arrows, change stacking order, numerous arrow options (rounded, orthogonal bends, arrow head, arrow tail, perimeter line)
- stocks, stock changes
- units: manage various unit types each with own color palet and number format, import/export
- scaling of flows (to max flow or absolute value) per unit type using slider
- print and export diagrams (jpg, bmp, png, gif, emf)
- floating / dockable / tabbed windows, update notfier
Visit http://www.e-sankey.com for a full list of features and download a trial version!
The maker, ifu Hamburg GmbH, is also the developer of Umberto, the leading tool for material flow analysis.

Keywords: Sankey, flow, diagram, chart, graph, graphics, visualise, visualize, visualisation, visualization, arrow, node, process, energy, mass, material, cost, costs, steam, waste, water, resource, efficiency, presentation, management, analysis, environment, engineering
|

Click to enlarge
|